Moogsoft Enterprise consolidates visibility and control of monitoring tools to help entire IT Ops and DevOps teams reduce noise, prioritize incidents, reduce escalations and ensure uptime. Working from anywhere, users can easily find and resolve the root cause of incidents before they become outages.
With version 8.0, customers can create a virtual Network Operations Center (NOC) using the Moogsoft Situation Room to collaborate throughout the incident management process, and diagnose and resolve problems quickly, regardless of team members’ physical location. The platform also provides IT Ops teams a single-pane-of-glass to replace multiple screens each dedicated to different monitoring tools.
With Moogsoft Enterprise 8.0, organizations now have the AIOps system of engagement they need to empower virtual Network Operations Center (vNOC) teams to resolve incidents before they affect customers.
Moogsoft will showcase the Virtual NOC and Moogsoft Enterprise 8.0 during a global live event on May 6.
Additional Resources
- White Paper: The Virtual NOC Is Here to Stay: AIOps Is Its Beating Heart »
- Infographic: Virtualize Your NOC with AIOps »
Alert Analyzer
In today’s modern IT world, events come from anywhere — applications, infrastructure, networks, cloud services and more — at a rate of millions per day, and with ever increasing variety and velocity. This makes identifying the root cause of an incident akin to finding a needle in a haystack.
To address this, and provide immediate value, Moogsoft Enterprise 8.0 introduces the Alert Analyzer — to identify anomalous and significant events and alerts using the patented Entropy algorithm. This feature automatically tames the flood of noisy events and alerts before they overload the IT Ops and DevOps teams.
Each ingested event or alert is assigned a value between 0 and 1 to indicate its importance. A value of 0 means that the alert is common and trivial ‘noise’, while a value of 1 means the opposite. As an example, the numerous heartbeat events sent from devices indicating they’re active are unimportant. However, a missed heartbeat would be an exception which should be surfaced as a possible indicator of a potential service interruption.
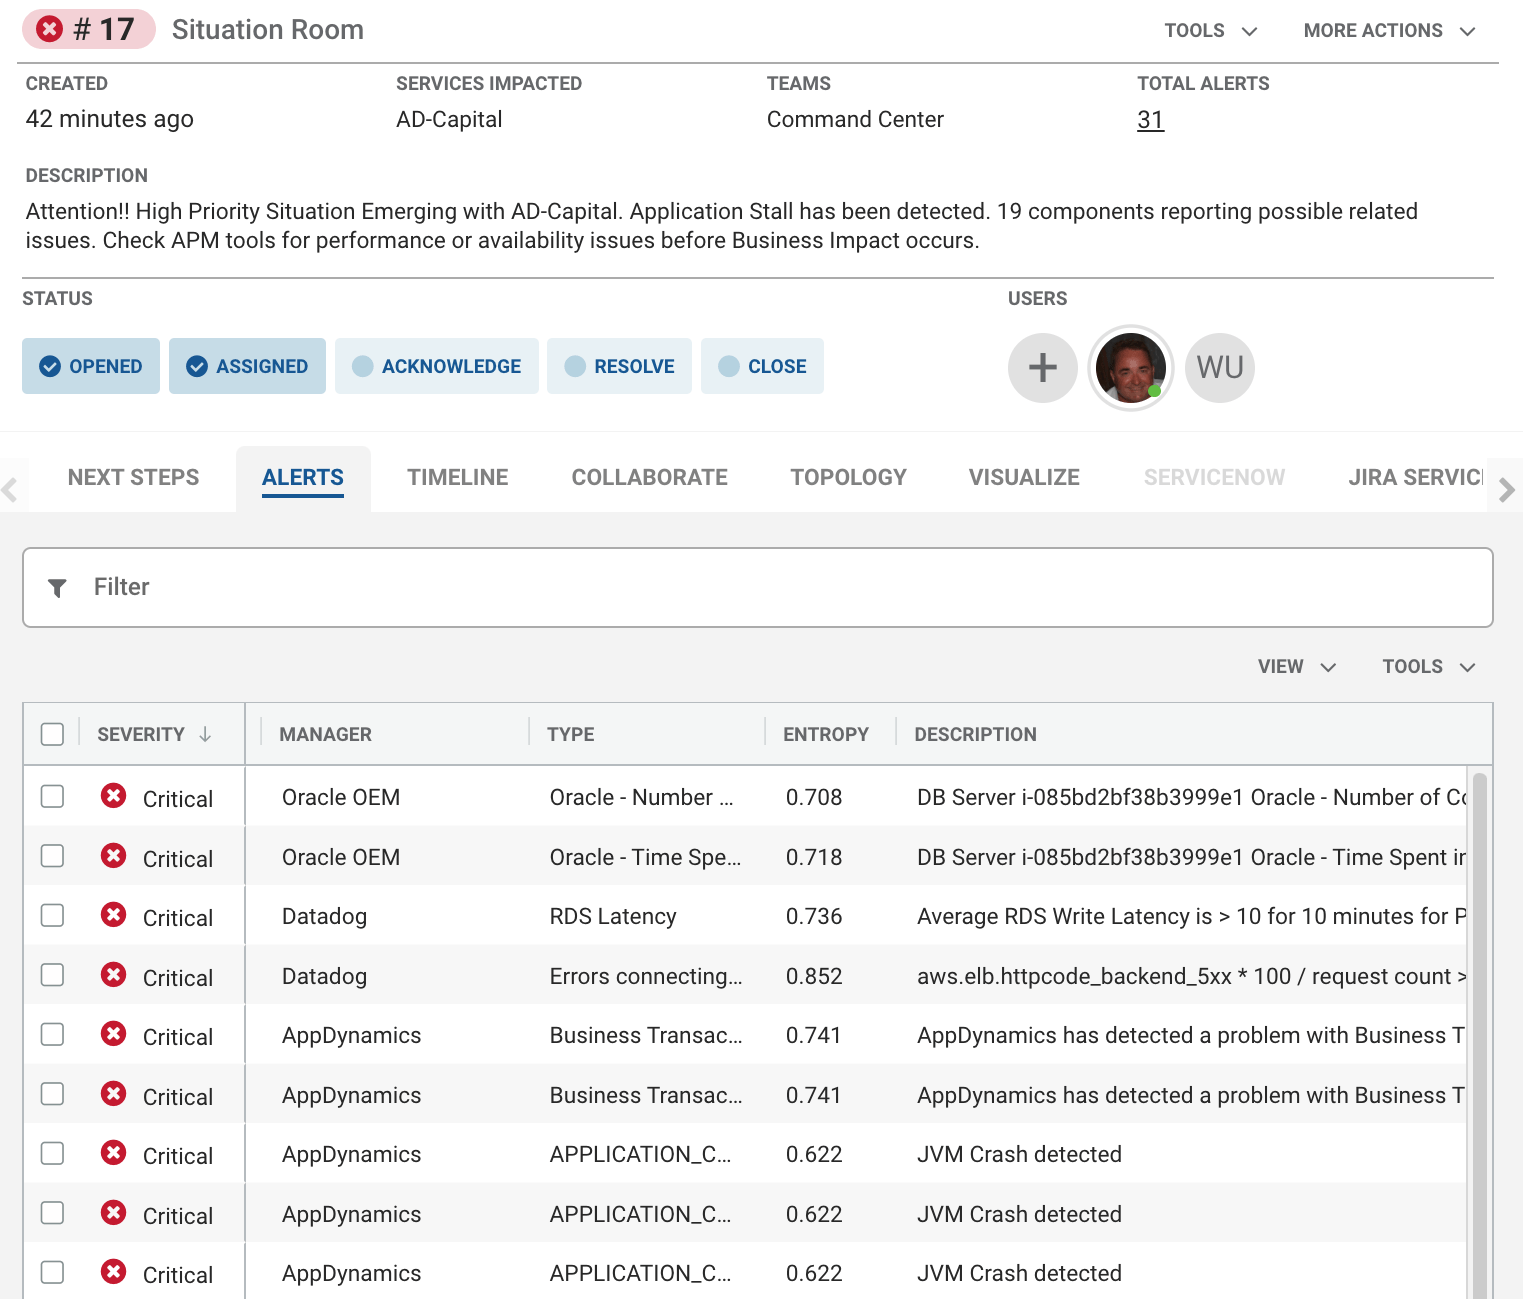
Figure 1: Each alert is analyzed and scored by the Moogsoft patented Entropy algorithm
The Alert Analyzer offers a dynamic graph to display the alert and the entropy value distribution, providing transparency for users to more precisely view the important alerts. The key here is to eliminate the noisy, non-actionable alerts without being forced to write a unique rule for each alert type and associated action. This automation of event and alert analysis happens before correlation. That way, there’s more context and similar alerts across multiple technology domains being correlated, accelerating mean time to resolution for incident management.
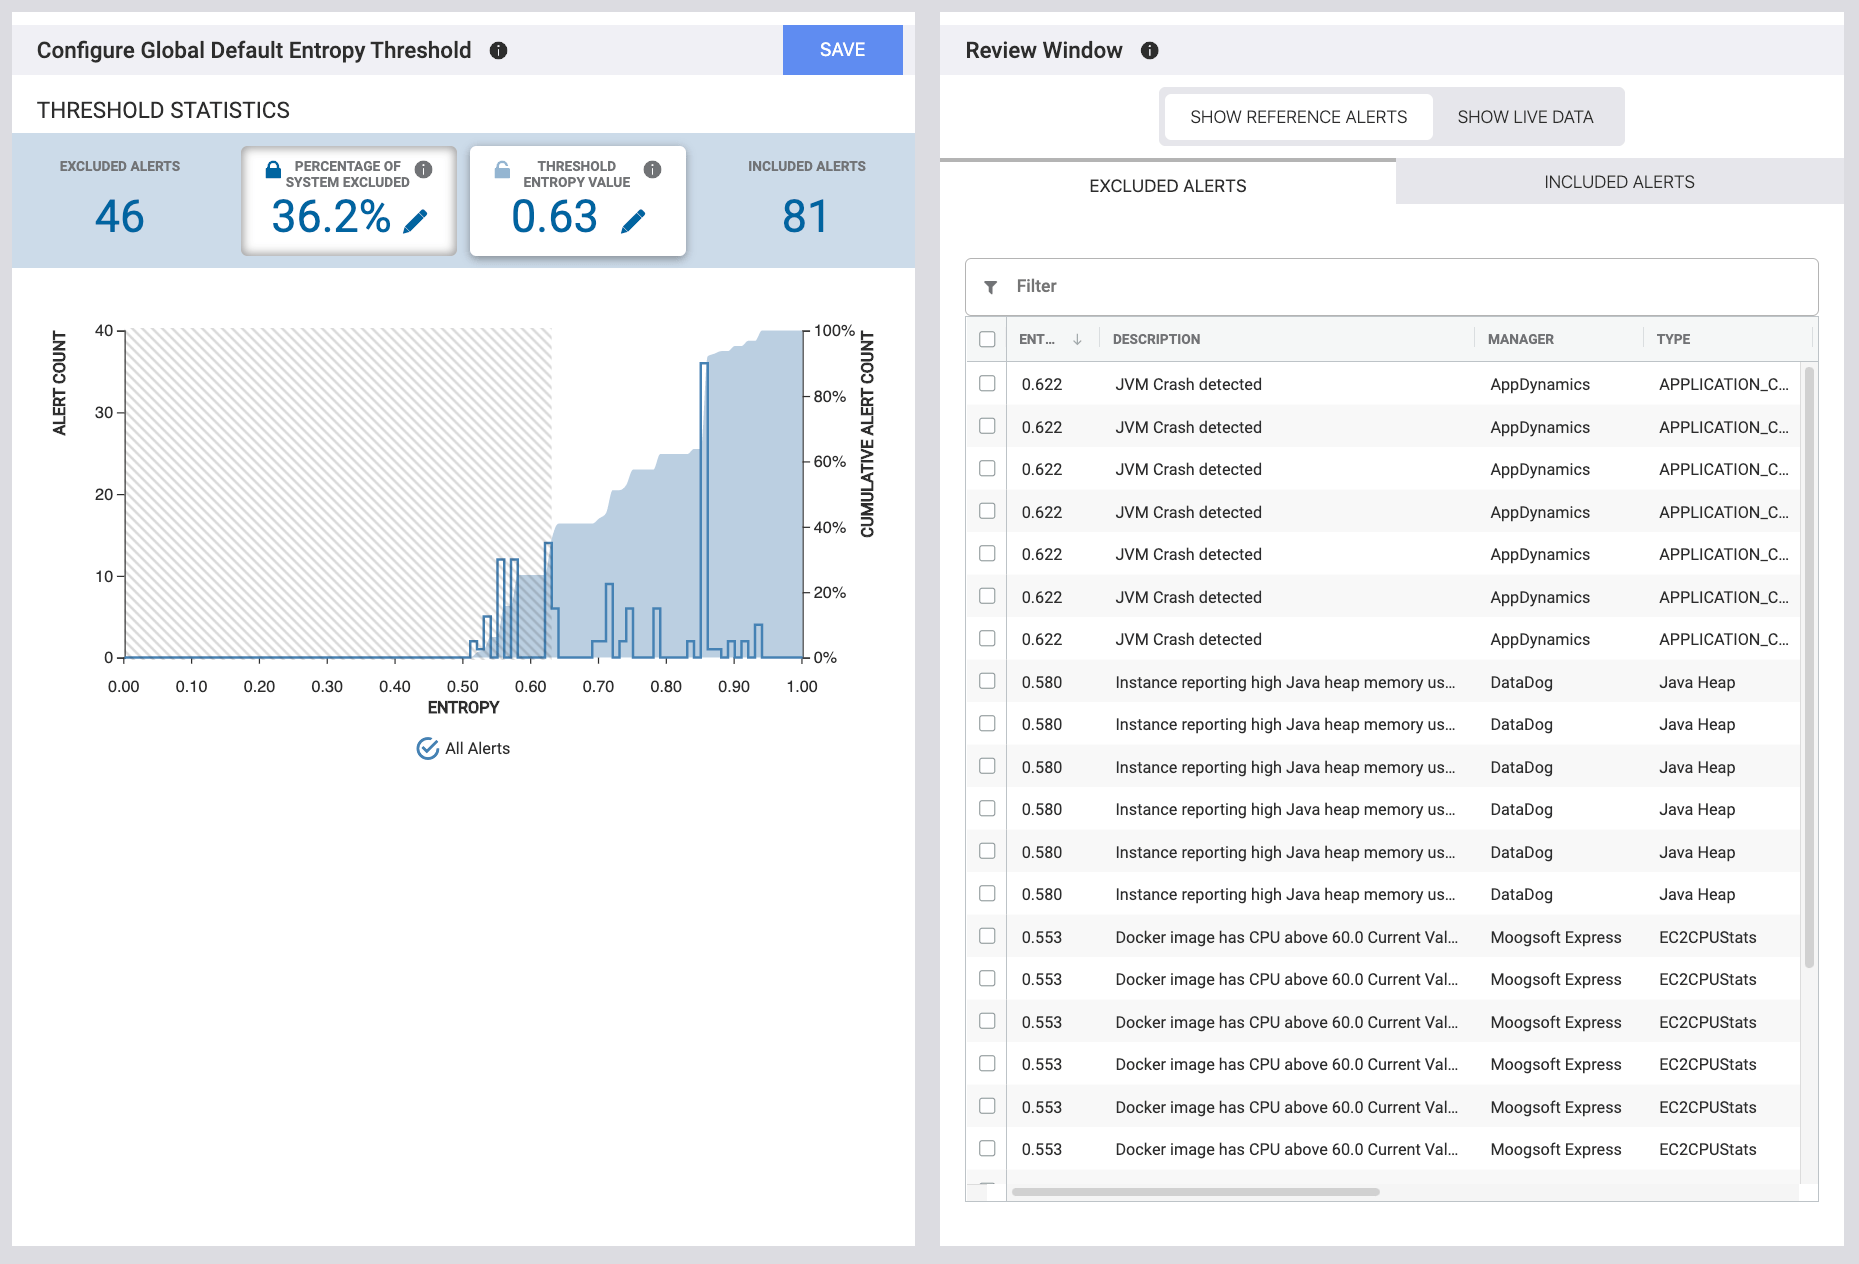
Figure 2: Global thresholds can be set to reduce alert noise
In addition to analyzing events and alerts at a global level, you can also view ingestion sources individually. The Alert Analyzer lets you analyze and track individual management or monitoring tools so you can isolate specific event sources. As shown in Figure 2, multiple management tools (for example AppDynamics and Datadog) each have their own threshold to filter noise and only correlate important alerts.
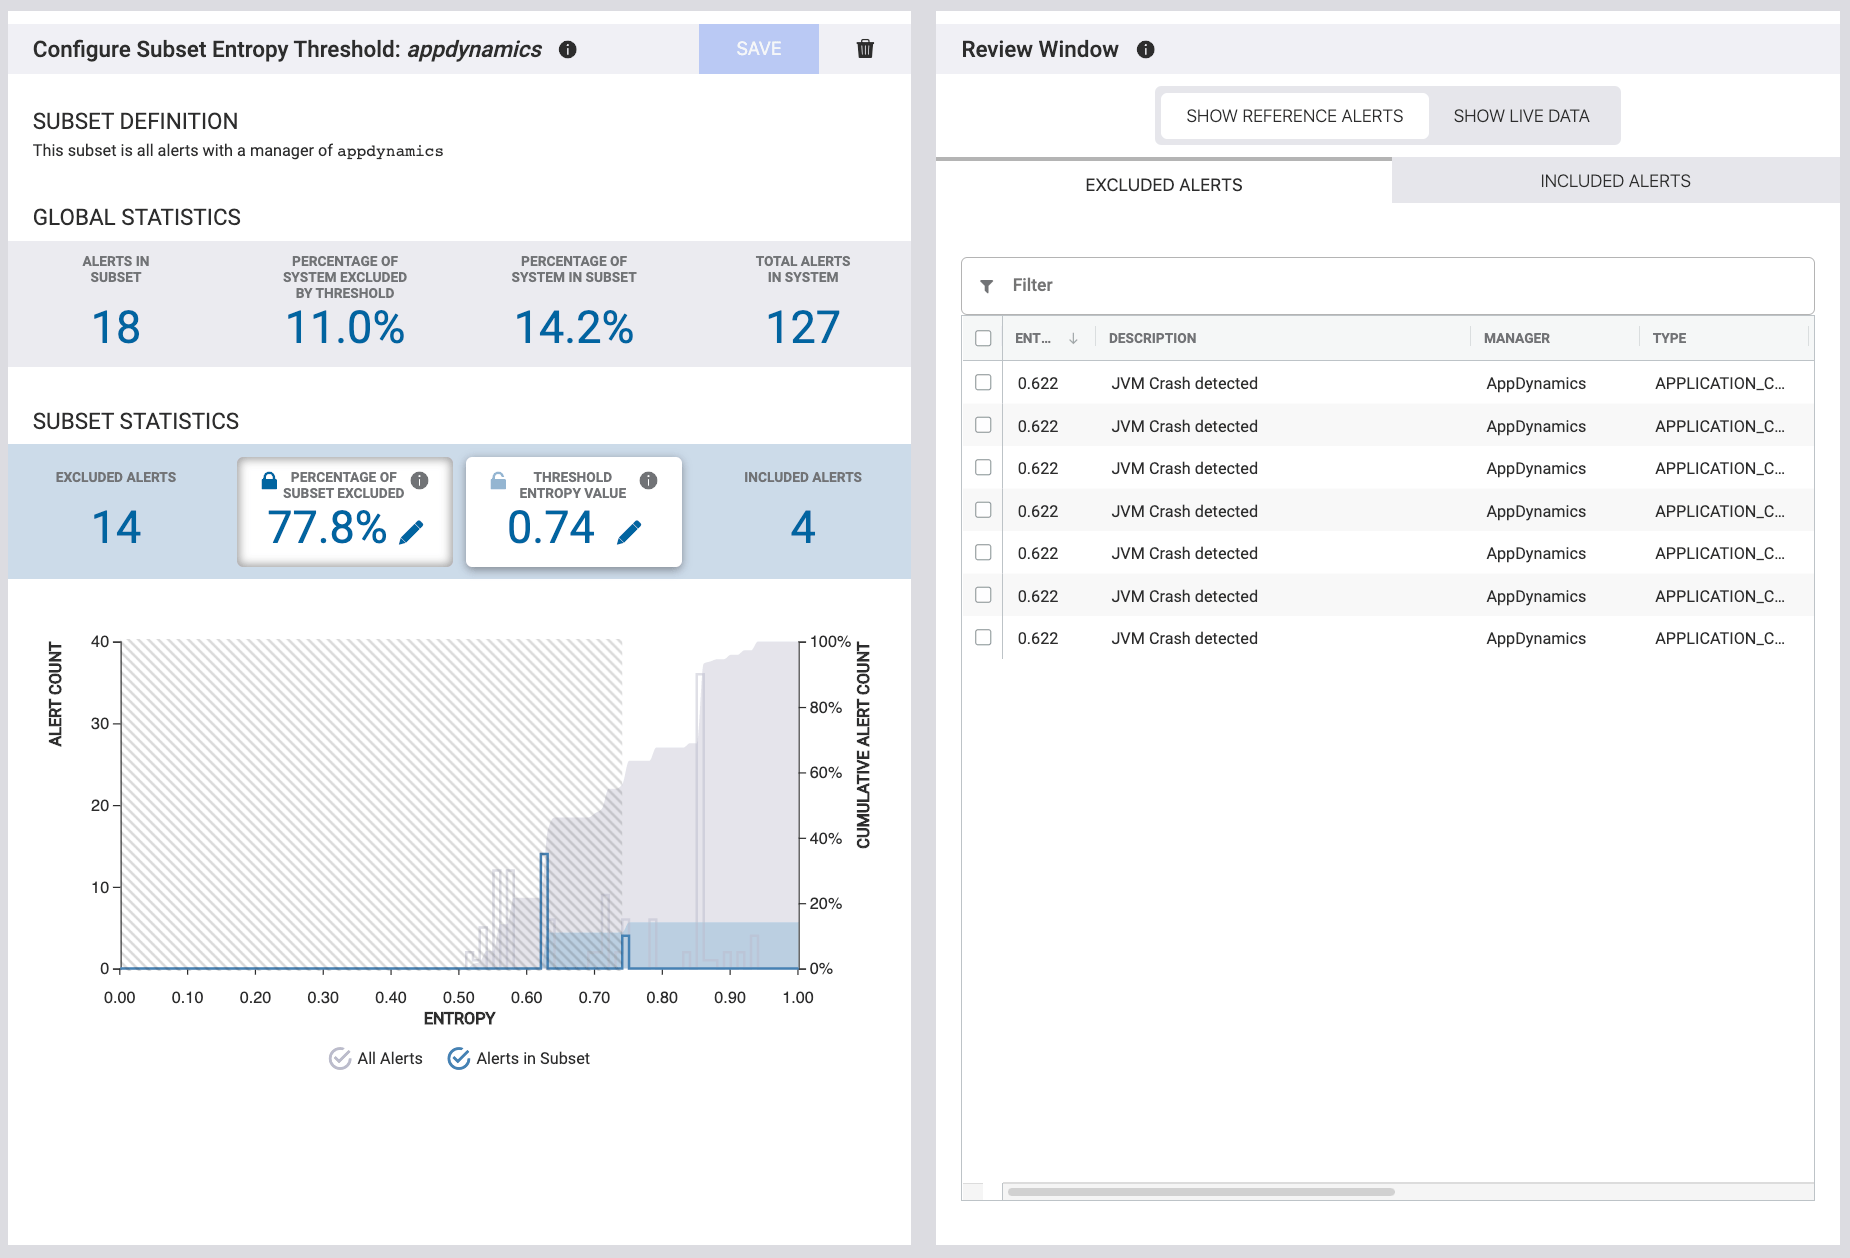
Figure 3: Thresholds can be set for individual ingestion sources for fine-tuning
Dynamic Topology Builder
The Dynamic Topology Builder provides a greater level of visibility into the correlation process, based on any topological relationships (e.g.: virtual, application, physical). This unique feature allows customers to immediately gain expanded insights into incidents in real time, and visualize the probable root cause and potential impact associated with current and neighboring services.
Application topology – AppDynamics
Using a multi-tier application architecture as an example, the Dynamic Topology Builder allows users to view all the alerts in the incident and their relationships, with the added ability to see the specific relationships in any topology. With an unlimited number of topologies, users now have their own views to visualize the effect of the incident up to four hops away. This gives users a powerful visual understanding of the effects of the ‘blast radius’ from their perspective and within the context of their domain responsibilities, along with the context and visibility into others domain responsibilities.
Cloud topology – AWS
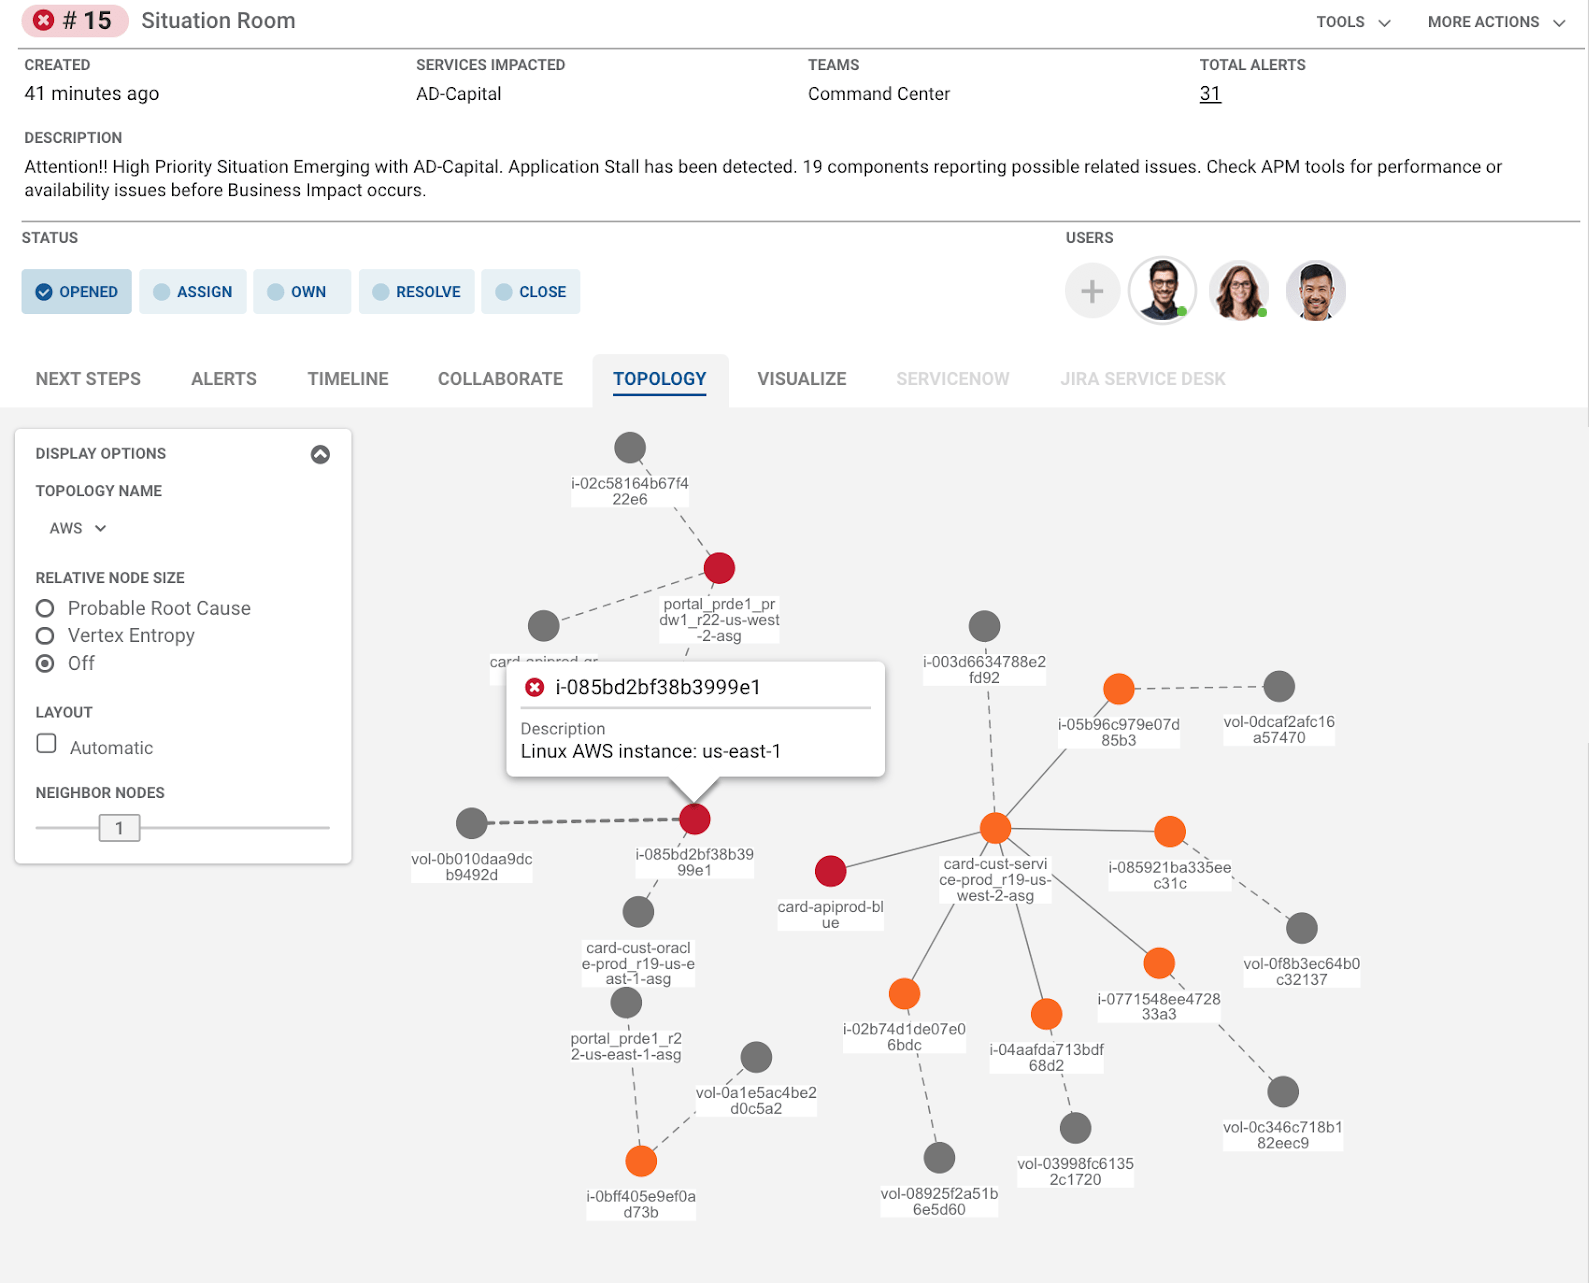
Another powerful use case is with software-defined networking. As SD-WAN and public cloud networking continue to be the fastest growing segments of the networking landscape, it is important to have a system of engagement that embraces the software overlay with a domain specific virtual topology view. As the total alert list may include multiple domains — application, network, server, storage or cloud services — having the ability to segment out specific domains, or groups of nodes, for deeper analysis is key to identifying and fixing the source of the incident quickly.
Figure 4: Nodes in the Topology represent AWS EC2 Instances and related services.
Topology API
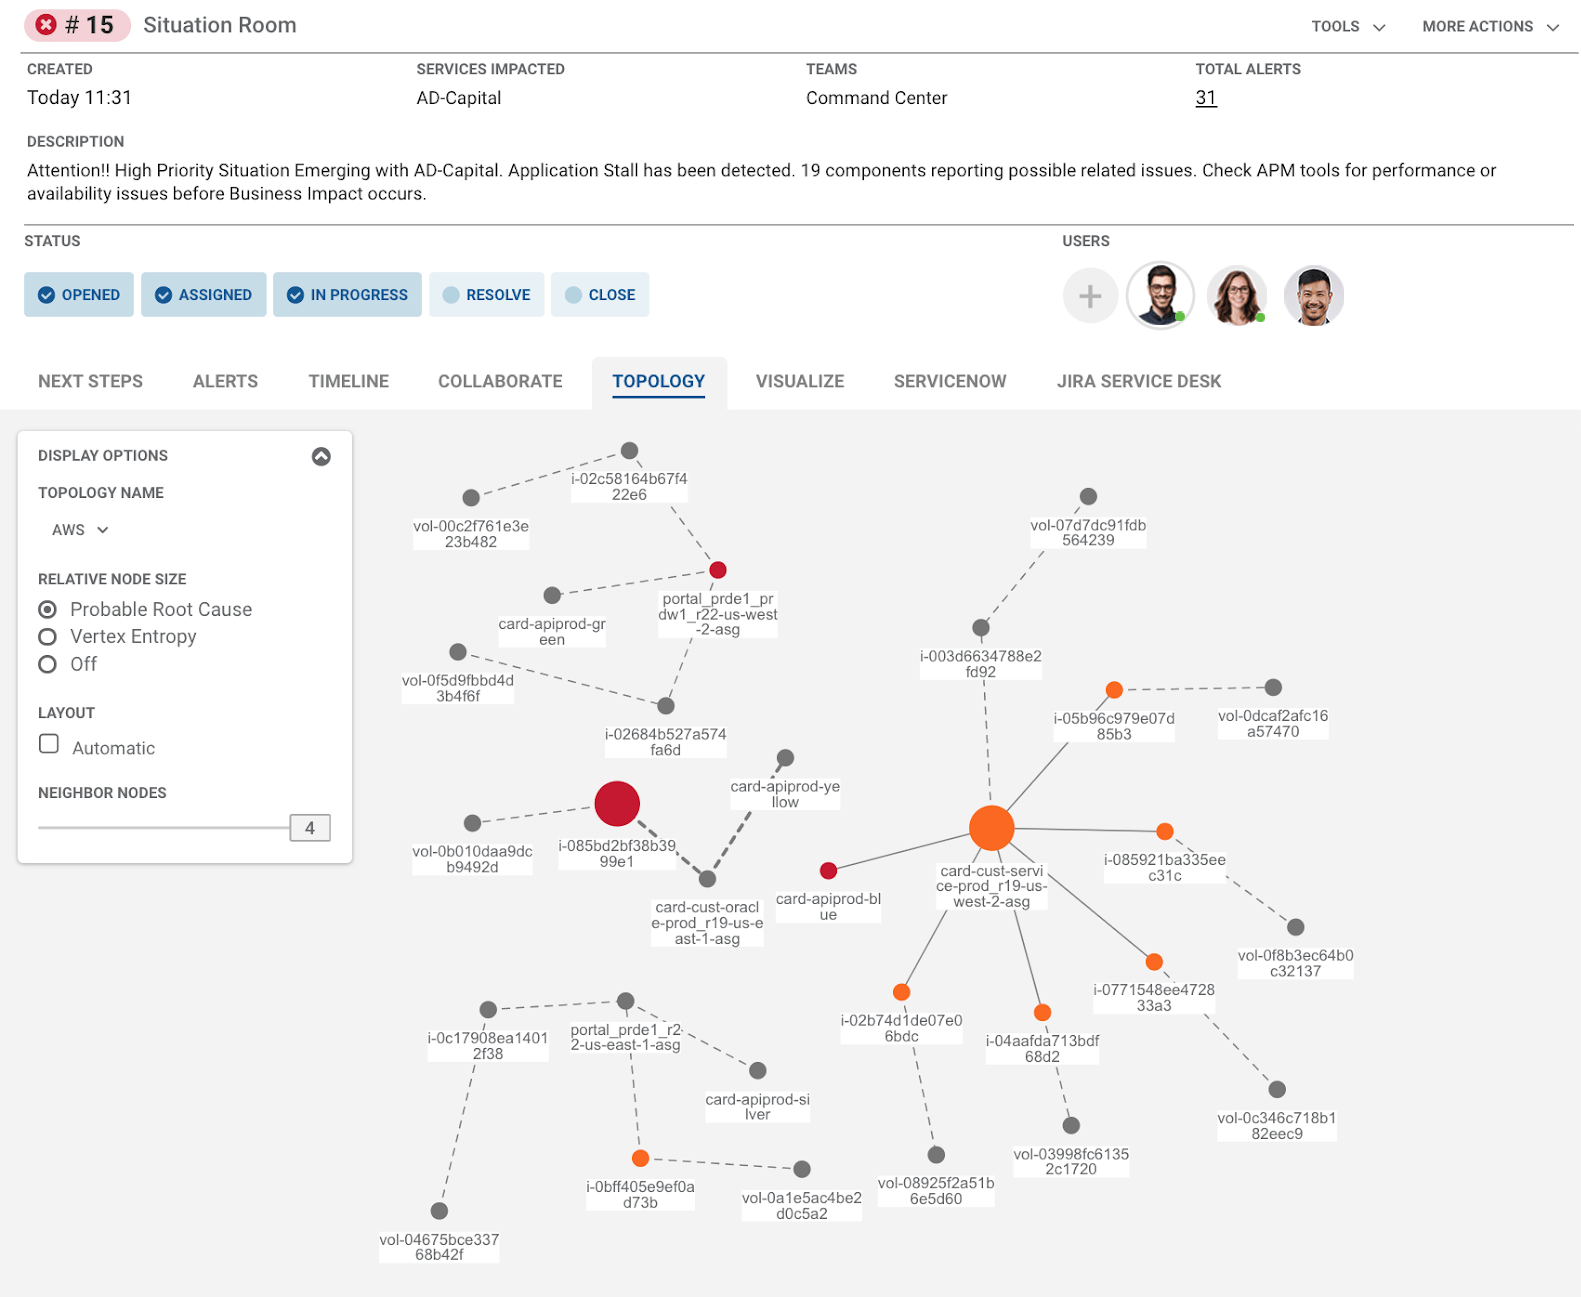
In addition, the topology view is dynamic, with regular updates based on active alerts, which are correlated within that specific incident. Moogsoft Enterprise 8.0 offers a topology API to get, create, update or delete topologies.
Figure 5: Topology views can be expanded to show neighbouring services as well as highlighting Probable Root Cause.
Enhanced Workflow Engine
Moogsoft Enterprise 8.0 delivers the latest iteration of the Moogsoft AIOps Workflow Engine (WE), and now enables customers to configure workflows and drive outcomes through an intuitive UI for each of the WE modules:
- Ingest: delivers user control for advanced configuration of the event flow.
- Enrich: enables customers to quickly enhance incoming data streams with external data sources including CMDB data directly from ServiceNow.
- Automate: delivers new functionality with Ansible, Chef and Puppet to drive advanced remediation solutions.
- Ticket: allows bi-directional integration into tools such as ServiceNow, Remedy, JIRA and Cherwell.
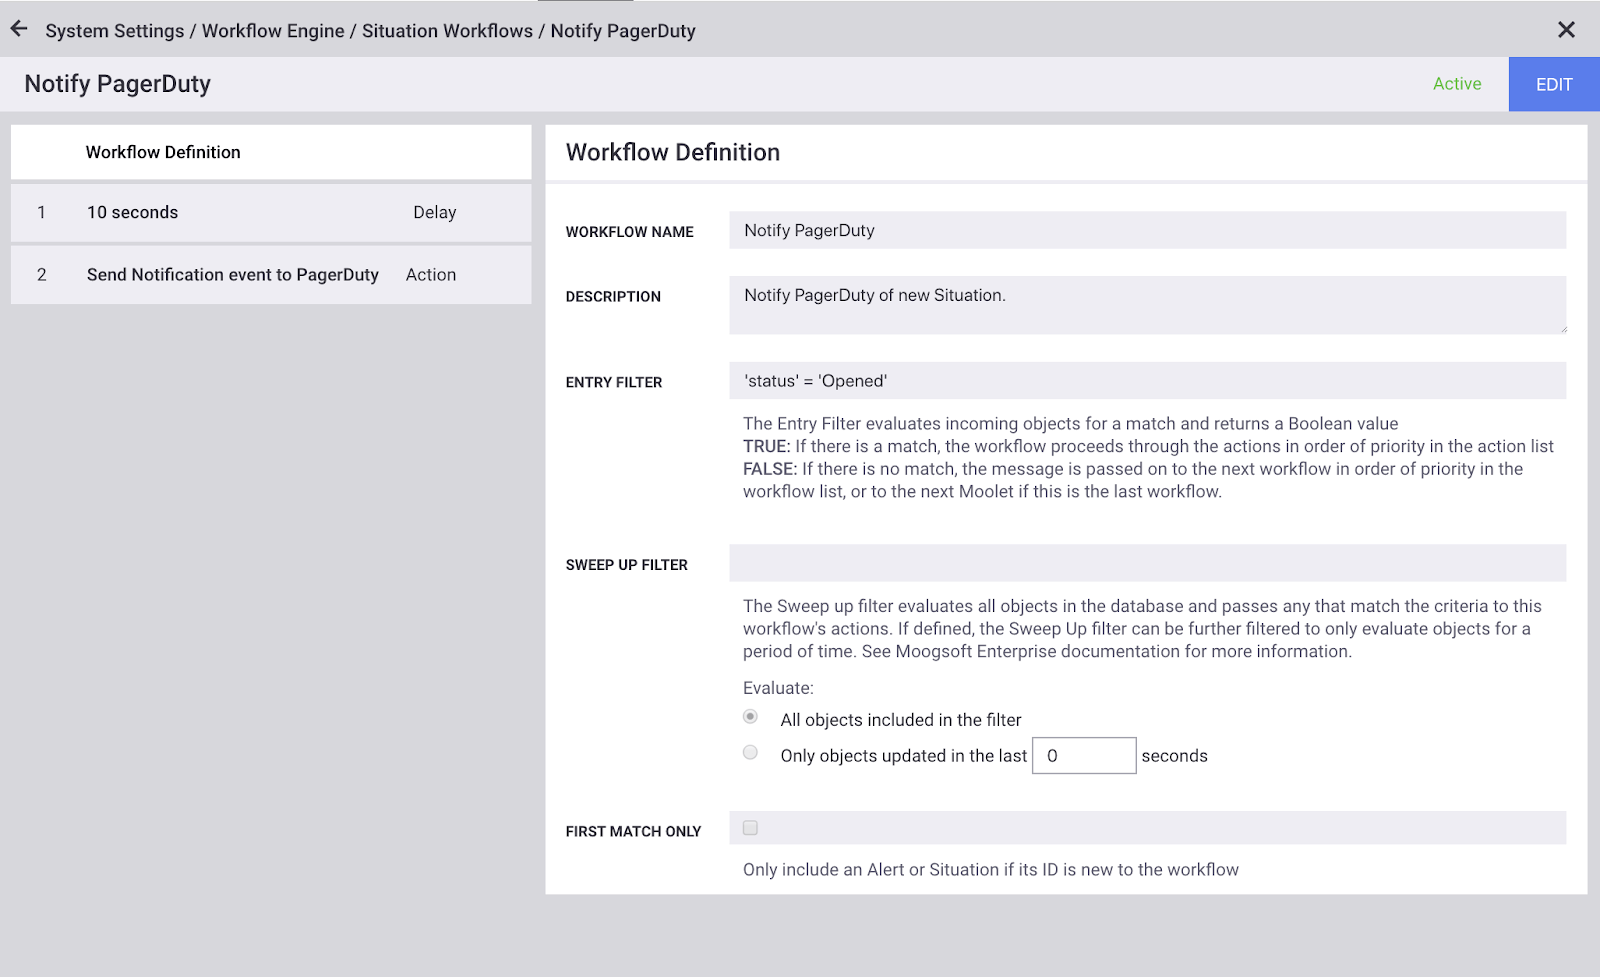
- Collaborate: easily configure PagerDuty, xMatters, Opsgenie and Slack for users to directly communicate with the Situation Room team members.
Figure 6: Workflows can be easily created to automatically escalate a Situation to PagerDuty.
Situation Visualize
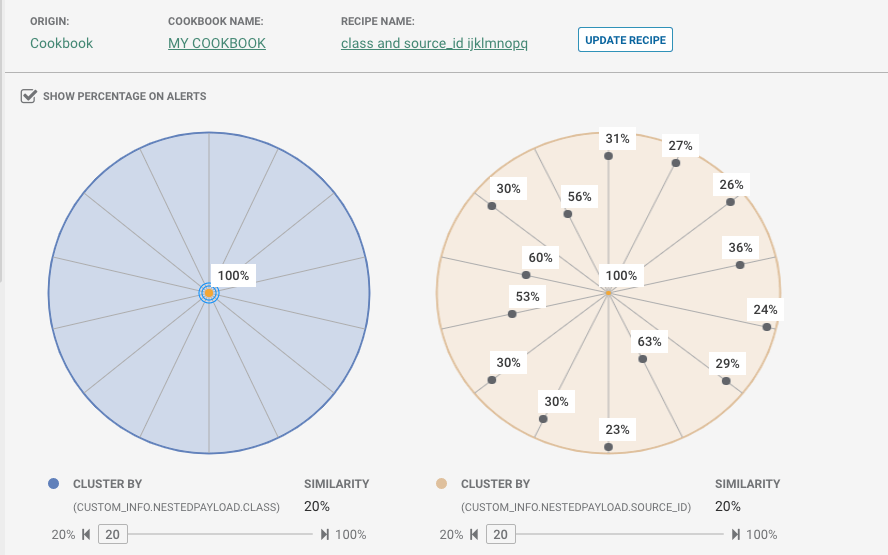
Situation Visualize, another unique capability in Moogsoft Enterprise 8.0, is available to users in the Situation Room. It gives users machine learning transparency, by graphically identifying the similarity of the alerts, and allows them to continue to train the correlation directly from the incident.
Figure 7: Complete transparency of correlation algorithms
This is powerful because users can now view the outcome of the machine learning before they commit any configuration change. This flexibility enables precision correlation for a variety of use cases across a breadth of industries and data.
Change History, Versioning & Rollback
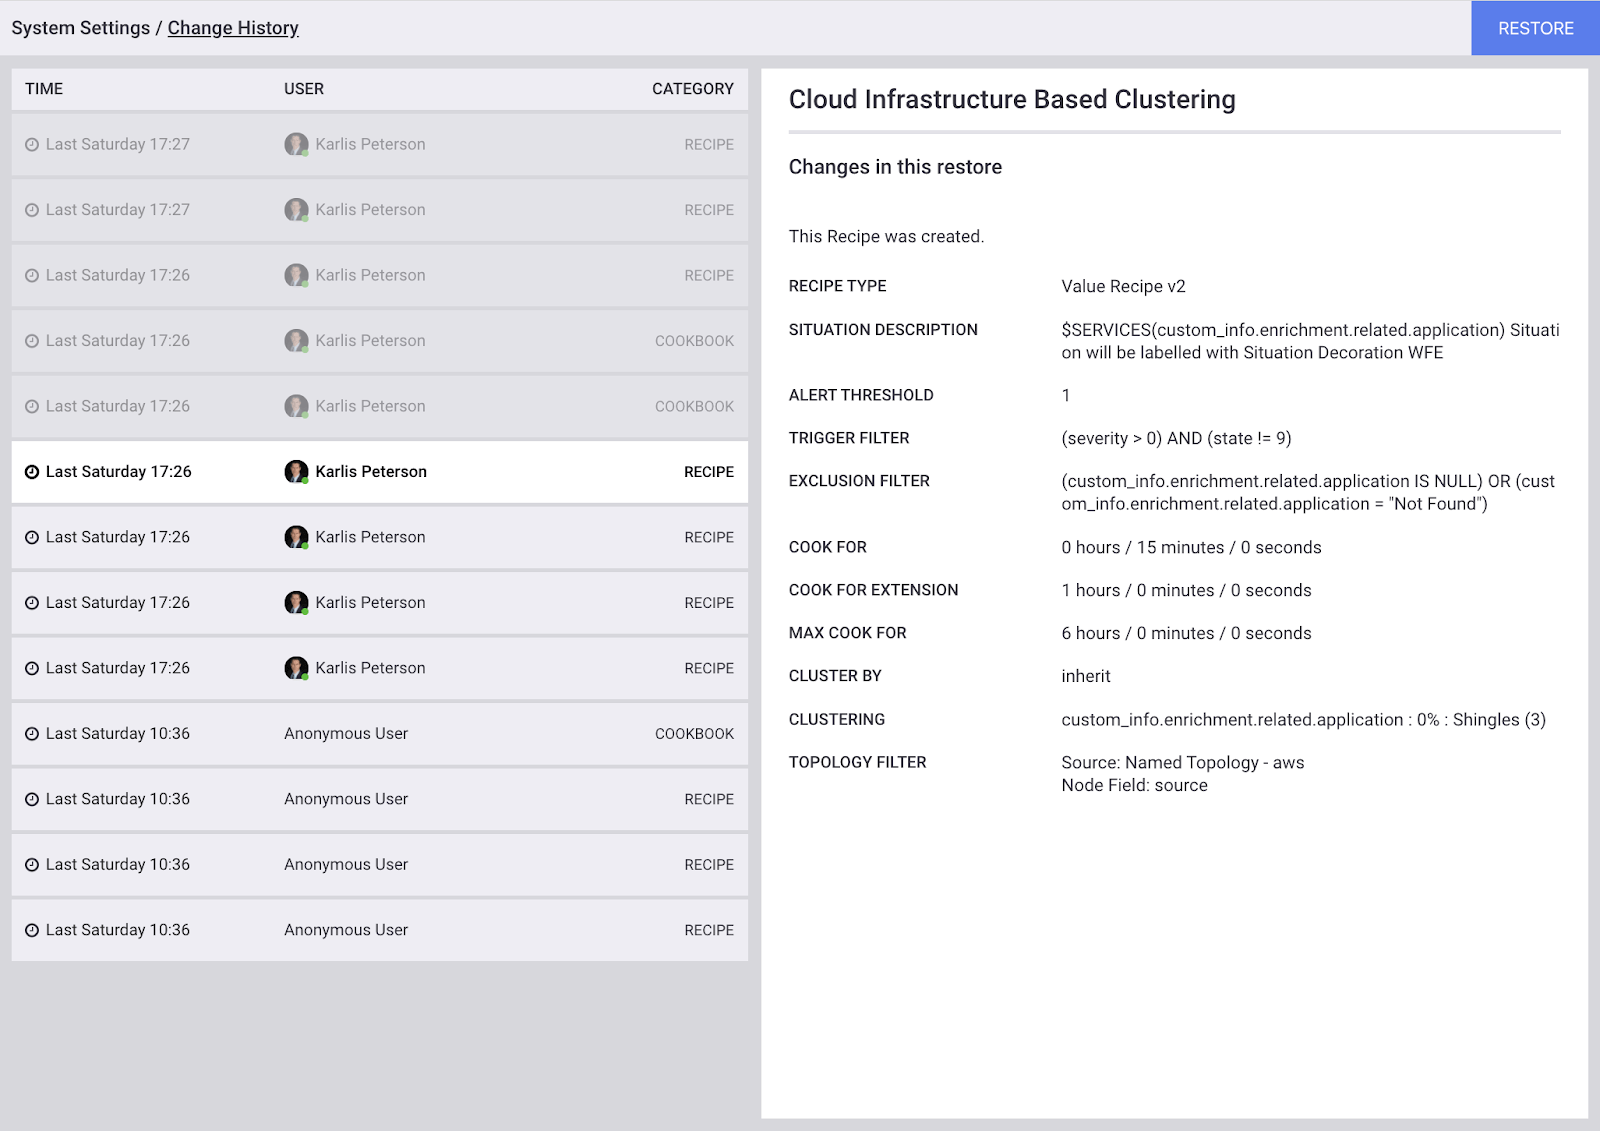
Knowing who made a change and when is a critical requirement for many organizations. Moogsoft Enterprise 8.0 delivers detailed change history for correlation algorithms, with rollback capabilities to any previous version.
Figure 8: Complete audit trail with rollback capabilities
Audit Logging
Administrators tasked with providing audit reports for governance, compliance or security rely on audit logs to identify ‘who did what, when and where’. Moogsoft Enterprise 8.0 delivers detailed audit logging for the events of each system setting: Security, System, Tools, Algorithms, Automation, and Display. For example, logged events can include:
- User sessions and authentication
- Authorization changes
- Configuration changes by administrators
New Integrations
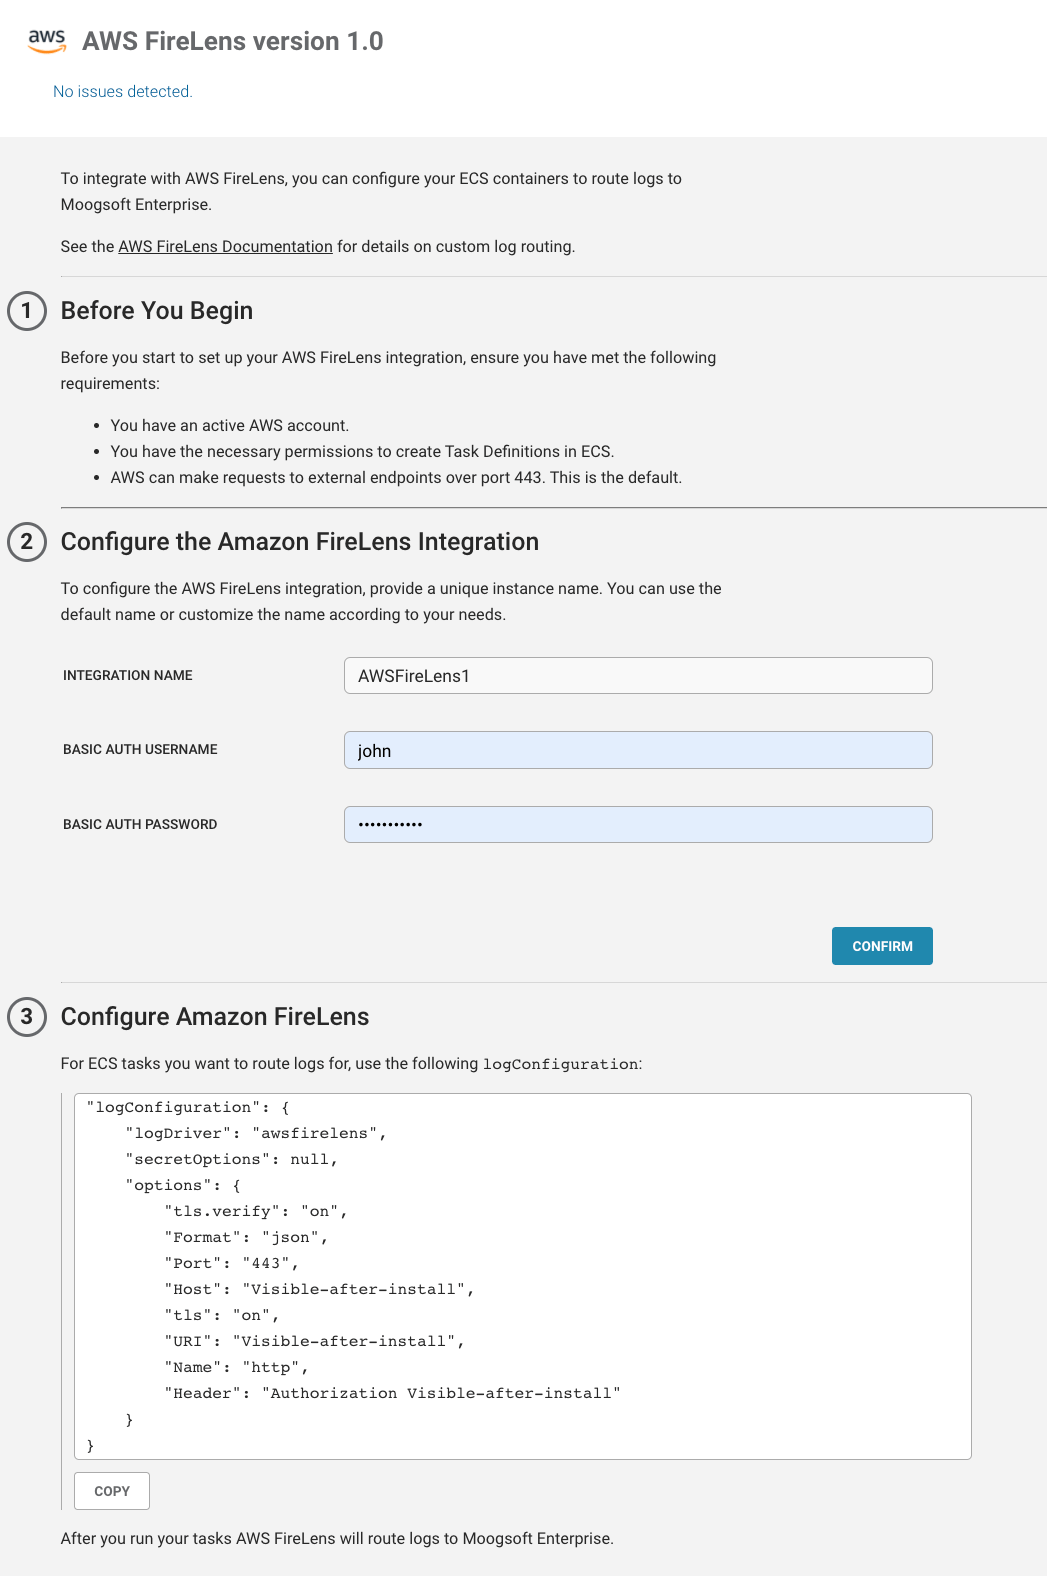
Moogsoft Enterprise 8.0 debuts new out-of-the-box integrations — including with AWS Firelens to ingest EC2 log files and with Opsgenie for on-call management. These Integrations are easily deployed via the UI and accelerate customers’ time to value. Just follow the instructions, it’s as simple as that.
Figure 9: Integration with AWS Firelens is just 3 steps away
PagerDuty Bidirectional Integration
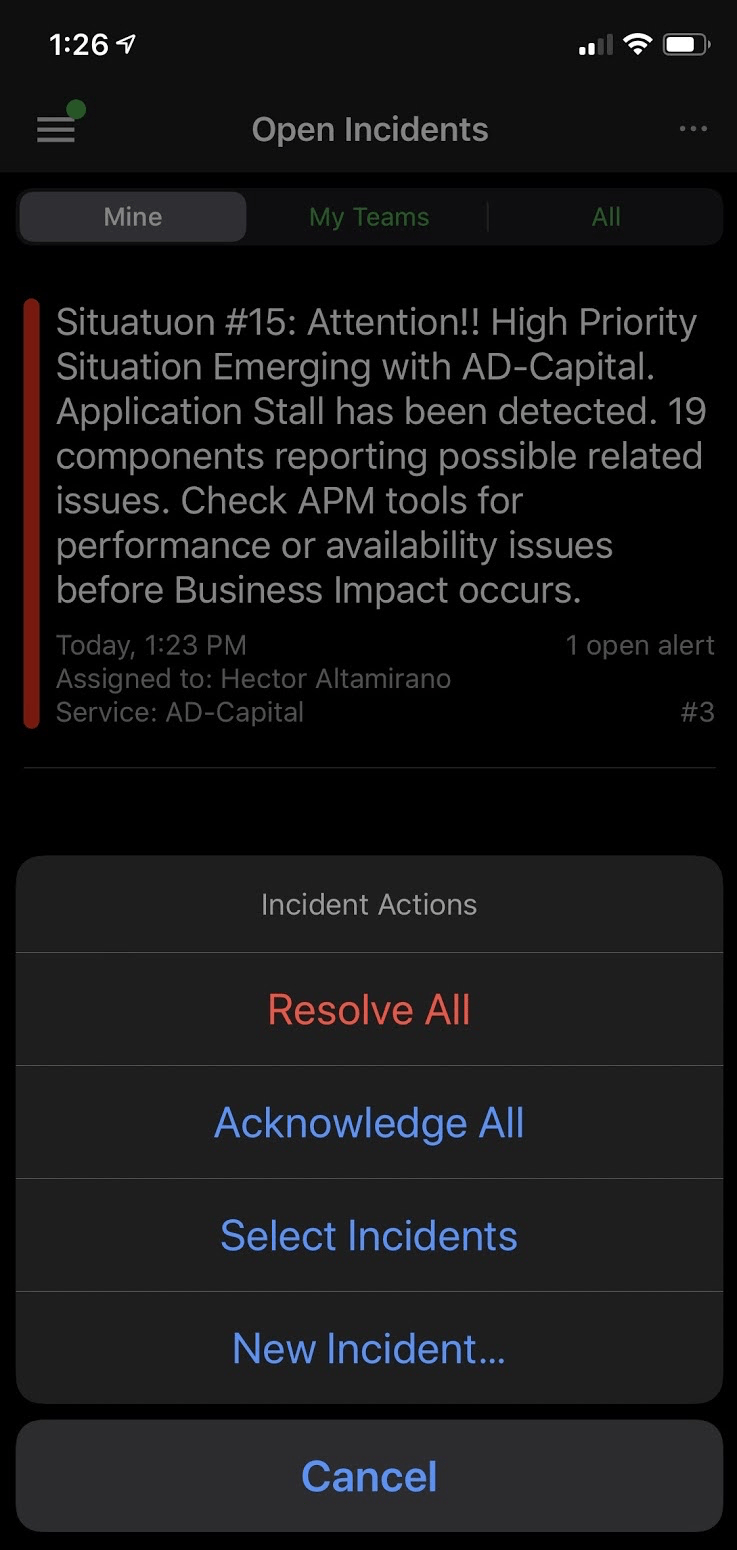
Moogsoft also announced a new joint solution based on a bidirectional integration with PagerDuty for real-time notification with any given Situation. This new functionality engages DevOps engineers in seconds, pointing them in the right direction with contextual and proactive insights to resolve incidents before there is any business impact.
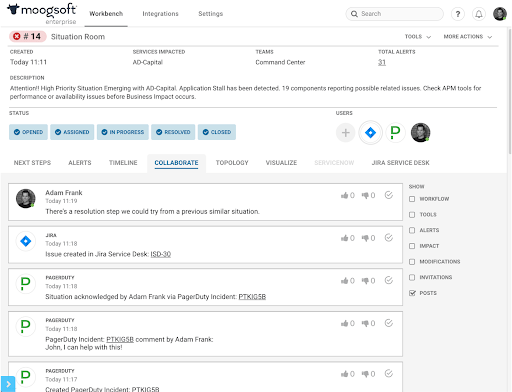
Figure 10: Seamless collaboration IT Ops, DevOps and SREs
Figure 11: Moogsoft Situation has been escalated to a support engineer using the PagerDuty mobile app.


