In this second installment of this blog series, we’ll discuss the importance of analyzing metrics, and how AIOps helps you with this fundamental pillar of observability. Without proper metrics analysis, you’re left blind to potential outages, or possibly worse — inundated with false positive anomalies, leading to alert fatigue and ultimately business impacts. Automated discovery and analysis can’t be achieved with legacy tools nor will it scale with humans. That’s why you need AIOps.
Before we get into our topic, let’s recap why we’re talking about metrics: Monitoring observability data is a fundamental part of your service assurance strategy and of delivering a great customer experience. Observability is the data from the deep internals of your infrastructure and applications: your log events, metrics and distributed traces. When this data is analyzed properly, using machine learning, you’ll obtain the understanding and insights needed to predict that an incident might occur, and be proactive when an incident does occur.
The Benefits of Metrics Analysis Outweigh Its Costs
Collecting metrics involves bandwidth considerations, processing delays, and storage costs. While they can be predictable and constant, these issues still exist, especially in today’s world, with its unquenchable thirst for on-demand, always-on services.
The good news is that today, despite the costs, it’s possible to collect and analyze metrics at remarkable scale and with unprecedented precision, thanks to advances in computing and IoT.
With today’s processing power, serverless architecture and cloud computing, AIOps platforms collect and analyze metrics directly at the source. By applying statistical algorithms and AI into localized collectors for real-time metric data analysis and trends, we can obtain actionable insights and detect anomalies, well beyond what’s possible with basic static thresholds (e.g.: a rule dictating alert generation when the CPU is above 90%). Think of this as distributed AIOps capabilities. In other words, AI diagnostics are built directly into source data.
Actionable Insights from Metrics Have Become a ‘Must Have’
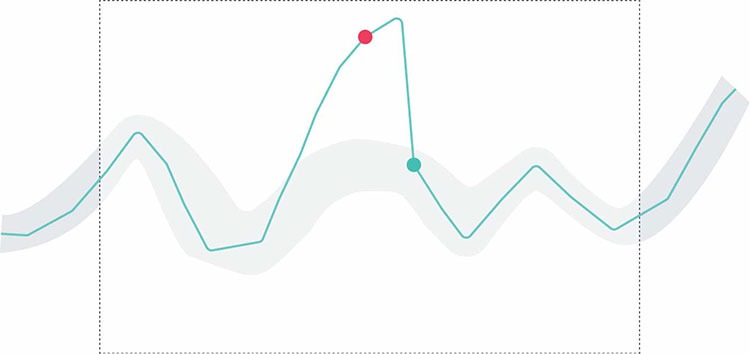
Every insight must be actionable. Otherwise, we quickly succumb to alert fatigue. Moogsoft AIOps delivers actionable insights more precisely, and more quickly, and with more context than legacy tools and approaches, because it uses scalable algorithms to analyze your data at several layers of processing in real time. It does this directly at the source of the data and of single metrics, to aggregations and beyond. The analysis allows adaptive thresholds to form around the metrics normal operating behavior.
When our AI-based analysis determines that a metric is outside the normal operating behavior, an anomaly will be generated.
Anomalies on the low side of a threshold typically are not thought of as issues, but nonetheless can indicate a real operating problem. For example, let’s say that you typically sustain between 60% and 80% CPU utilisation on your front-end web farm servicing your customers. Then all of a sudden your CPU drops and is now sustaining below 20%. That’s a very real indication a problem is occurring and that customer-facing services may be impacted. This is a type of anomaly and alert that in most environments goes completely undetected, unless you’re using an AIOps / AI-based system.
By determining what the normal operating behaviour is, Moogsoft AIOps will automatically generate an upper and lower threshold surrounding the metric, thus generating an anomaly when the metric falls outside the threshold.
We must also keep in mind the seasonality that occurs in your day-to-day transactions so we can recognize when outlier metrics are actually within the acceptable norm, given the circumstances of your current business. Once again, an AIOps platform will help you with this by continuously analysing the data for changes to determine and adapt with acceptable changes in the data.
A common issue with most statistical approaches is the assumption that a given metric has some form of normal distribution around a mean. If we have a normal distribution, we can estimate very easily the standard deviation and use that with various techniques to work out how likely a given value is part of that random distribution or is instead a genuine anomaly.
This probability is the pValue and the smaller the value the less likely the value is to be “normal”. The assumption of normality leans upon the “central limit” theorem, which says that any value which itself is the sum of other random values will be normal whatever the underlying distributions of the values.
In the real world, this is rarely a true statement as it relies upon any of the underlying values being independent and disconnected. If they are not, the sum will not have a normal distribution. Let’s use CPU as the example, a composite of the random fluctuations of the CPU consumption of all of the apps and kernel on the box. They are specifically not independent. They are related and indeed the kernel controls who gets what system resources. As a consequence we cannot rely upon the distribution being normal.

Central limit theorem distribution
Here’s how Moogsoft AIOps tackles these challenges, and this is how it allows you to analyze metrics in a way that yields true observability.
Method I
The first method Moogsoft AIOps uses for accurately determining an anomaly involves utilising a robust measure of the variability of a univariate sample of quantitative data along with a range of probability distributions. It then calculates the deviation separately for above and below the median. In other words, we count any number from the opposite side as the median itself.
This provides the statistical robustness needed. Naturally, we have to be considerate of the collector footprint and the amount of memory we’re consuming against the actual memory constraints. So, we should be selective with a rolling window (rolling average) of data points, while ensuring a high level of accuracy is maintained.
The process starts by persisting a previous time window to forecast the next window, smoothing the short-term fluctuations and highlighting long-term ones. To add to this involves using a distribution independent approach to scoring anomalies, computing the underlying distribution to directly calculate the pValues. Using 1-pValue combined with deviations indicates a higher value is ‘more’ of an anomaly, then translating that to the colours and severities we all love and know, ensuring an accurate and robust approach against variance.

Single metric anomaly
Method II
The next method is remembering values over arbitrary time intervals to fill in the gaps and accurately begin to make essential predictions. After all, lags of unknown duration are inevitable. This allows the model generation service and adaptive calculations to keep thresholds tight and detect anomalies, without causing false positives, while detecting periodicity (seasonality). The model service analyses the anomalous data on the server side. This is a step in multivariate analysis. This service analyses the anomalous data to construct a ‘model’, which can then be refined by the user, and downloads to the collectors. The model is used in scenarios when metrics follow the same pattern. The collector still analyses the data at the source to continue generating anomalies but it doesn’t need to determine that pattern since it has already been determined and informed. At this point it will generate valid anomalies or falsify the model and begin to discover a new pattern.

A distributed model for multiple metrics
Method III
Finally, AIOps automates multivariate analysis to infer whether an anomaly is a contributor, influencer or indicative of a real problem. Due to the distribution and scalability of the solution, multivariate analysis is performed at multiple layers within (an example would be the model explanation above). This involves a combination of anomaly streams in real-time. The algorithms at this point must adjust accordingly to achieve a high accuracy of actionable anomalies while understanding the commonalities and relationships.

Combining anomaly streams for multivariate analysis
Moogsoft AIOps combines the above approaches with multi-vector analysis and sensible default controls like a ‘hold for’ value of 1. This way a metric has to be out of normal operating behavior for more than one data point (i.e.: two consecutive data points). Typically single data-point spikes or drops are quite tolerant in today’s robust environments. Sensible defaults and multi-vector analysis allows accounting for some deviations, durations, and densities.
There is Not a Rule or a Symbolic Inference in Sight
Will Cappelli, Moogsoft Field CTO, has explained Moogsoft’s approach towards metrics and anomalies quite beautifully. He starts by pointing out that Moogsoft’s pattern discovery and anomaly detection are all math-based. This means that, in the end, it’s just a question of repeatedly applying a sequence of functions to incoming streams of numerical data, without a rule or symbolic inference in sight.
This is critical because most attempts to apply AI to metrics invoke a set of “if-then-else” rules and require repeated applications of modus ponens, according to Cappelli. This often involves utilizing straight recursion and, in the process, chewing up a lot of memory and compute cycles.
In Cappelli’s own words: “Applying mathematical functions to numbers, by contrast, is highly efficient and easy on memory. So, in the end, Moogsoft is able to exhibit significant analytical prowess without being a resource burden. Moogsoft’s algorithms are designed to work on continually mutating objects while the collectors that actually execute those algorithms can be situated as close to the source of the data generation as makes sense.”
Next on our journey to distribute AIOps to an omniscient observability solution we’ll discuss real-time log event streams and persisting message metadata to memory. That makes it possible to keep only those logs that match query criteria or deviations, with the ability to iteratively identify the relevant subset of logs. Combining that with analysing the complex rates would provide an actionable insight without storing all the logs. Stay tuned!
See the other posts to date in the series here:


